
English


Paperback
₹212
₹235
9.79% OFF
(All inclusive*)
Delivery Options
Please enter pincode to check delivery time.
*COD & Shipping Charges may apply on certain items.
Review final details at checkout.
Looking to place a bulk order? SUBMIT DETAILS

Piracy-free

Assured Quality

Secure Transactions
About The Book
Description
Author
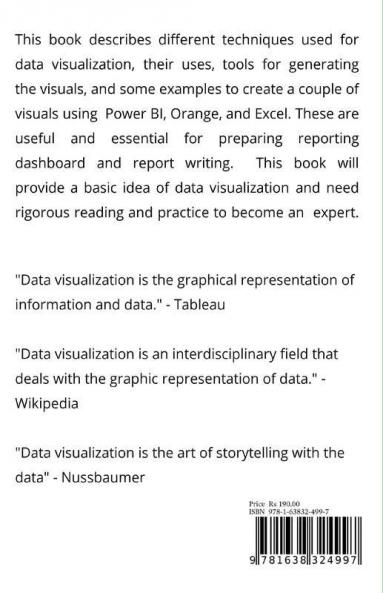
<p>This book describes different techniques used for data visualization their uses tools for generating the visuals and some examples to create a couple of visuals using Power BI Orange and Excel. These are useful and essential for preparing reporting dashboard and report writing. This book will provide a basic idea of data visualization and need rigorous reading and practice to become a visualization expert. This book will help university students and the professionals working or intended to work in this field.</p>
Piracy-free
Assured Quality
Secure Transactions
Delivery Options
Please enter pincode to check delivery time.
*COD & Shipping Charges may apply on certain items.
Review final details at checkout.
Details
ISBN 13
9781638324997
Publication Date
-23-02-2021
Pages
-158
Weight
-153 grams
Dimensions
-139.7x215.9x6.69 mm
Imprint
-Notion Press
