English

Paperback
₹10921
₹13092
16.58% OFF
(All inclusive*)
Delivery Options
Please enter pincode to check delivery time.
*COD & Shipping Charges may apply on certain items.
Review final details at checkout.
Looking to place a bulk order? SUBMIT DETAILS

Piracy-free

Assured Quality

Secure Transactions
About The Book
Description
Author
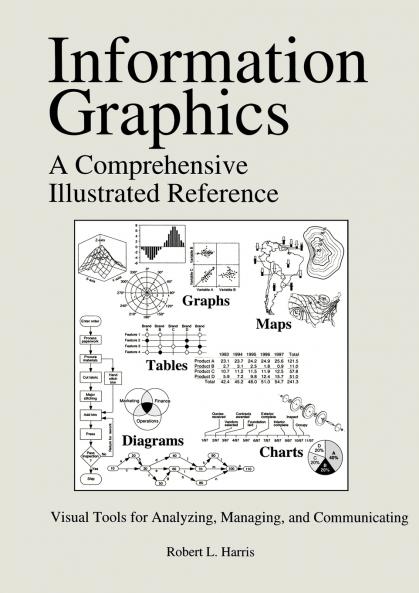
This beautifully illustrated book is the first complete handbook to visual information. Well written easy use and carefully indexed it describes the full range of charts graphs maps diagrams and tables used daily to manage analyse and communicate information. It features over 3000 illustrations making it an ideal source for ideas on how to present information. It is an invaluable tool for anyone who writes or designs reports whether for scientific journals annual reports or magazines and newspapers.
Piracy-free
Assured Quality
Secure Transactions
Delivery Options
Please enter pincode to check delivery time.
*COD & Shipping Charges may apply on certain items.
Review final details at checkout.
Details
ISBN 13
9780195135329
Publication Date
-01-01-2000
Pages
-450
Weight
-1085 grams
Dimensions
-210x297x23.13 mm
