
by
Allen Yu
English


Paperback
₹3419
₹3599
5% OFF
(All inclusive*)
Delivery Options
Please enter pincode to check delivery time.
*COD & Shipping Charges may apply on certain items.
Review final details at checkout.
Looking to place a bulk order? SUBMIT DETAILS

Piracy-free

Assured Quality

Secure Transactions
About The Book
Description
Author
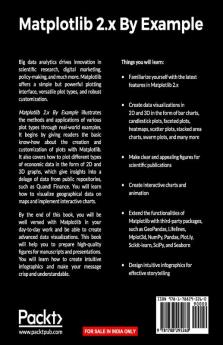
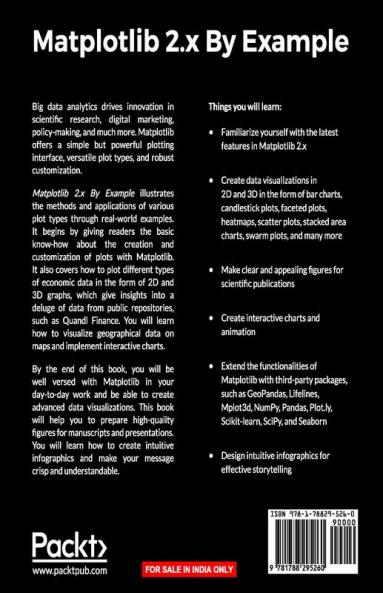
Unlock deeper insights into visualization in form of 2D and 3D graphs using Matplotlib 2.x About This Book • Create and customize live graphs by adding style color font to make appealing graphs. • A complete guide with insightful use cases and examples to perform data visualizations with Matplotlibs extensive toolkits. • Create timestamp data visualizations on 2D and 3D graphs in form of plots histogram bar charts scatterplots and more. Who This Book Is For This book is for anyone interested in data visualization to get insights from big data with Python and Matplotlib 2.x. With this book you will be able to extend your knowledge and learn how to use python code in order to visualize your data with Matplotlib. Basic knowledge of Python is expected. What You Will Learn • Familiarize with the latest features in Matplotlib 2.x • Create data visualizations on 2D and 3D charts in the form of bar charts bubble charts heat maps histograms scatter plots stacked area charts swarm plots and many more. • Make clear and appealing figures for scientific publications. • Create interactive charts and animation. • Extend the functionalities of Matplotlib with third-party packages such as Basemap GeoPandas Mplot3d Pandas Scikit-learn and Seaborn. • Design intuitive infographics for effective storytelling. In Detail Big data analytics are driving innovations in scientific research digital marketing policy-making and much more. Matplotlib offers simple but powerful plotting interface versatile plot types and robust customization. Matplotlib 2.x By Example illustrates the methods and applications of various plot types through real world examples. It begins by giving readers the basic know-how on how to create and customize plots by Matplotlib. It further covers how to plot different types of economic data in the form of 2D and 3D graphs which give insights from a deluge of data from public repositories such as Quandl Finance. You will learn to visualize geographical data on maps and implement interactive charts. By the end of this book you will become well versed with Matplotlib in your day-to-day work to perform advanced data visualization. This book will guide you to prepare high quality figures for manuscripts and presentations. You will learn to create intuitive info-graphics and reshaping your message crisply understandable. Style and approach Step by step comprehensive guide filled with real world examples.
Piracy-free
Assured Quality
Secure Transactions
Delivery Options
Please enter pincode to check delivery time.
*COD & Shipping Charges may apply on certain items.
Review final details at checkout.
Details
ISBN 13
9781788295260
Publication Date
-28-08-2017
Pages
-334
Weight
-585 grams
Dimensions
-191x235x17.76 mm
